Enhance Google Slides Presentation Looks
Google Slides is the online spreadsheet editor created by Google. The presentation conveys the information to the audience from the speaker. It uses the visual medium to tell the info that is understandable to the audience. The information is simplified into images, tables, audio, video, and charts. Much complex information is simplified using the slides. The aesthetics of the presentation improved using Google Slides. Numerous templates improve the slide look. Smart art, images, shapes, graphics, and videos enhance the slides. The workspace tips & tricks for students and beginners are available here.
Add Visuals to Your Slides
Videos and images convey complex information more simply. There are many ways to improve your presentation. You can add images, videos, graphs, and animations to the Google slides. Let us see about adding media to the Google slides one by one.
Add an image to Google slides
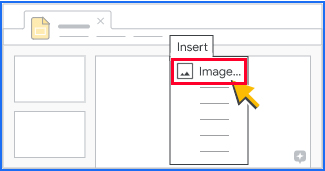
If you want to add an image to your presentation, use the below options. There are three methods to add an image to Google Slides.
- Drag an image from the desktop to the slide.
- Click the add image or insert option to upload your image from the computer.
- Go to the bottom of your slide & click the explore option and use the images you want.
How to add videos to a presentation
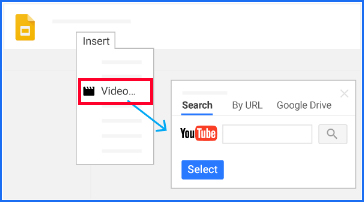
First, go to the insert option and click the videos tab. Further, there are three options to add the video to the slides.
- By Search Bar
- By URL
- From Google Drive
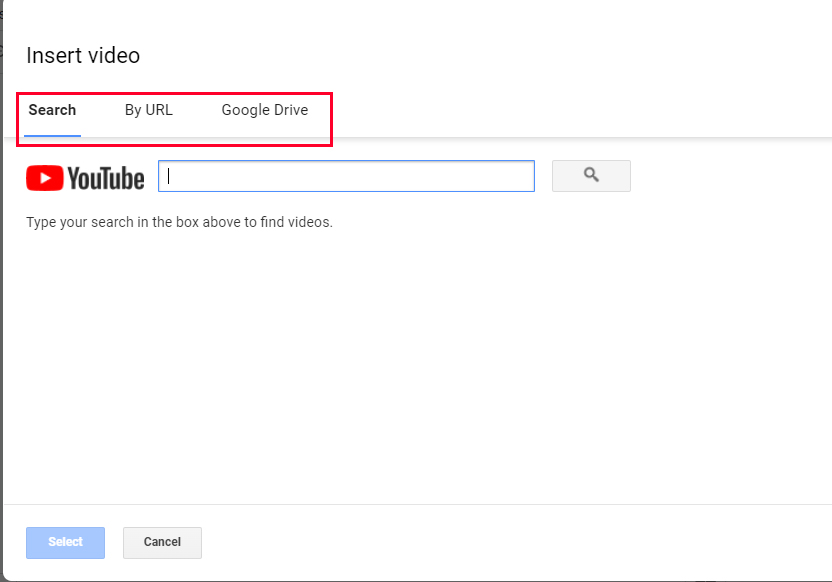
By search Bar
- Search video from the YouTube search bar.
- Choose the video from the list.
- Select the video
By URL
- Copy and paste your URL in the URL box.
- Click the select option and add the video.
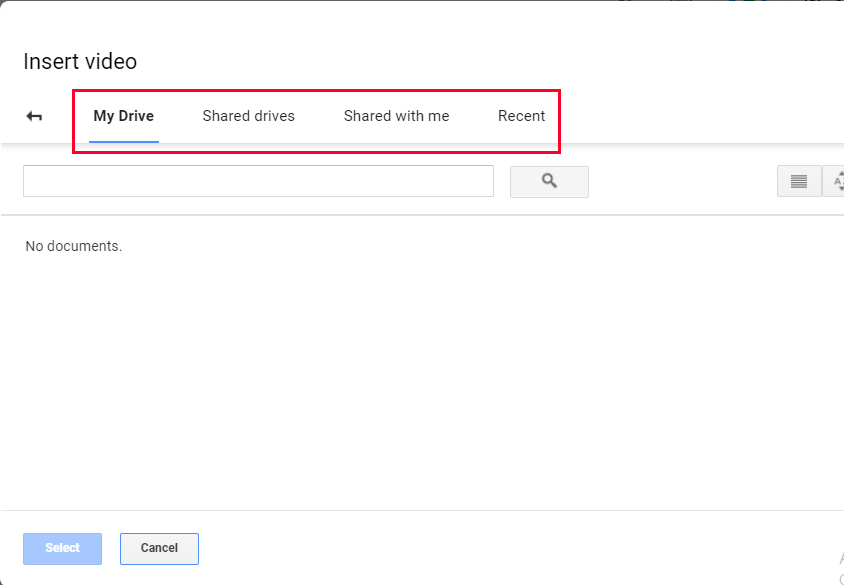
From Google Drive
- Go to the Drive option and a video from the drive.
- You can add the video to the following options.
- My drive,
- Shared drives,
- Shared with me,
- Recent.
- Select the video from the above option and add the video.
Add Graphsare
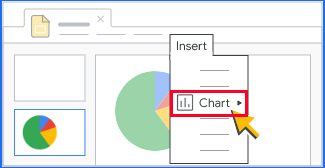
The information is shared as a pie chart, and bar graph, in the slide. Go to the insert option and add the following charts.
- Bar chart
- Line chart
- Column chart
- Pie chart
Create diagrams & Flowcharts
To explain the complex information you can use diagrams and flowcharts. Using the diagram options you can add shapes and text. Steps to follow to create a diagram or flow chart is given here.
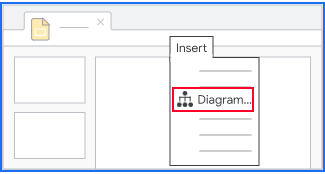
- Click on the place you want to add the diagram/flowchart to the slide
- Add combinations of shapes
- Next, to edit the shapes you have the following options.
- Drag one of the points on the shape to resize a shape.
- Change the shape of the flower using the fill color option.
- The border color is changed with the help of the border color option.
- You can change the border width with the border weight.
- Change your border type by the option Border dash.
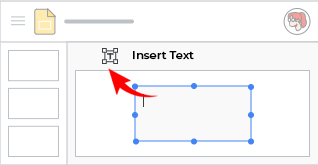
Insert Text & Diagrams
Text is added to the slide by adding the text box inside the slide. If you want to add the diagrams to the slide, go to the insert option and insert the diagrams as following diagrams. Further, diagrams are customized after selecting the diagram.
- Grid
- Hierarchy
- Process
- Relationship
- Cycle
Tips & tricks for beginner students for google slides are given. The basics of how-to slides look aesthetically explained. The detailed updates about google workspace are regularly updated here. Know more about google workspace here.
Google Sheets Beginners Tips Guide
How to Share Files from Google Drive?
Google Slides Time Saving Tips
Lastly, Navohosting offer services like
- Google workspace
- Web hosting
- Website design
