Google Workspace Diagnostic Tools
Google Workspace is an online collaboration application suite. The workspace consists of the business version of applications used by small to large organizations. Some issues will arise during Google Workspace setup or at any time. The administrator can troubleshoot the issues using the diagnostic tools. Users cannot troubleshoot issues on their own. Admins can use the admin toolbox to provide solutions to users. The Google Workspace diagnostic tools are easy–to–use troubleshoot Google Workspace service issues.
Google Admin Toolbox
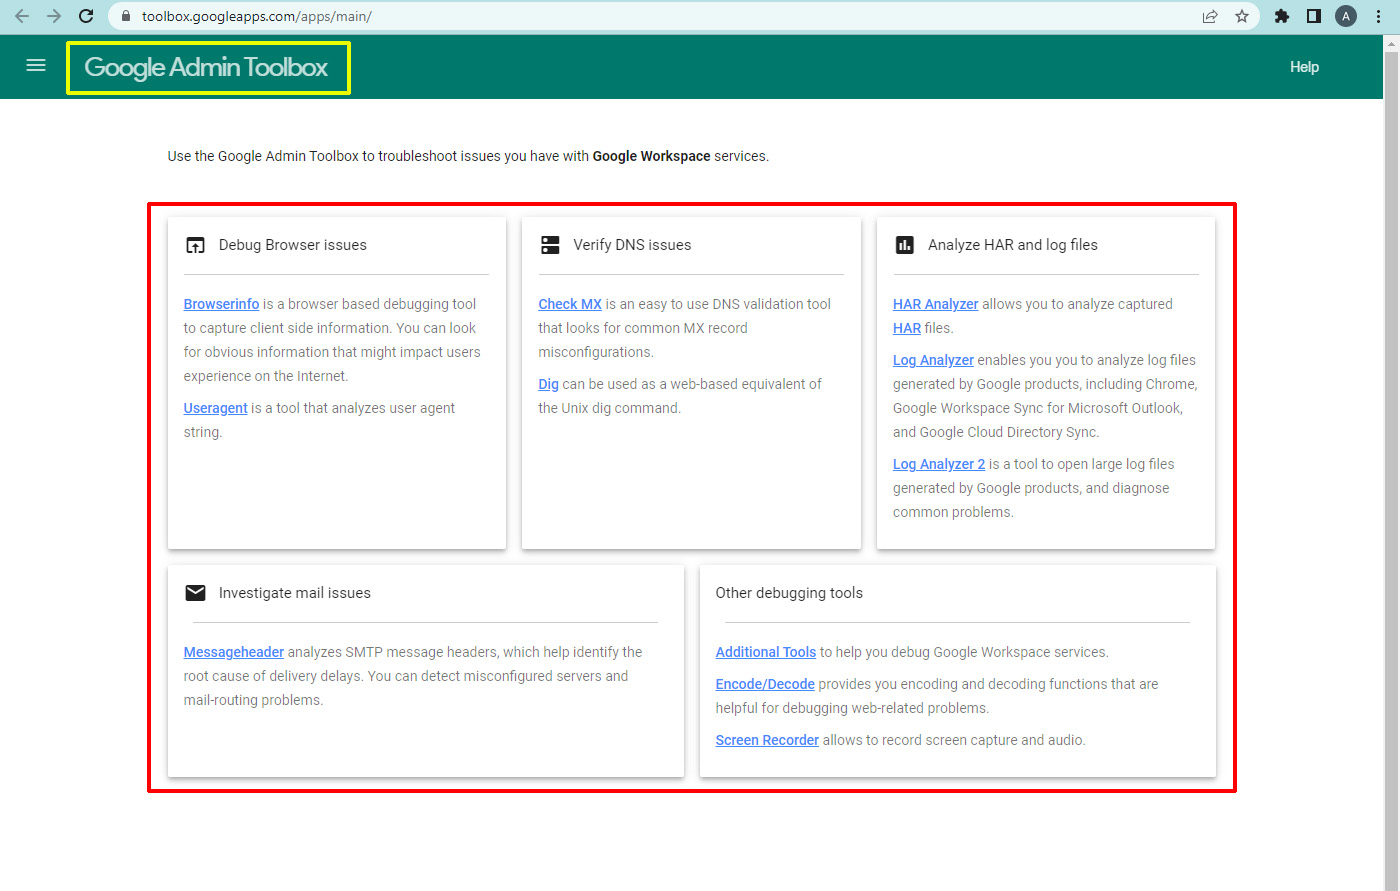
The Google admin toolbox is used to troubleshoot issues with Google Workspace. The Google admin toolbox has many sections. The sections are available for troubleshooting browsers, DNS, mail, HAR, and log file issues. It also has other debugging tools like encode/ decode, Calendar troubleshooter, Flush DNS cache, Gmail errors, chrome connectivity diagnostics, Web RTC troubleshooter, and screen recorder.
Debugg browser issues
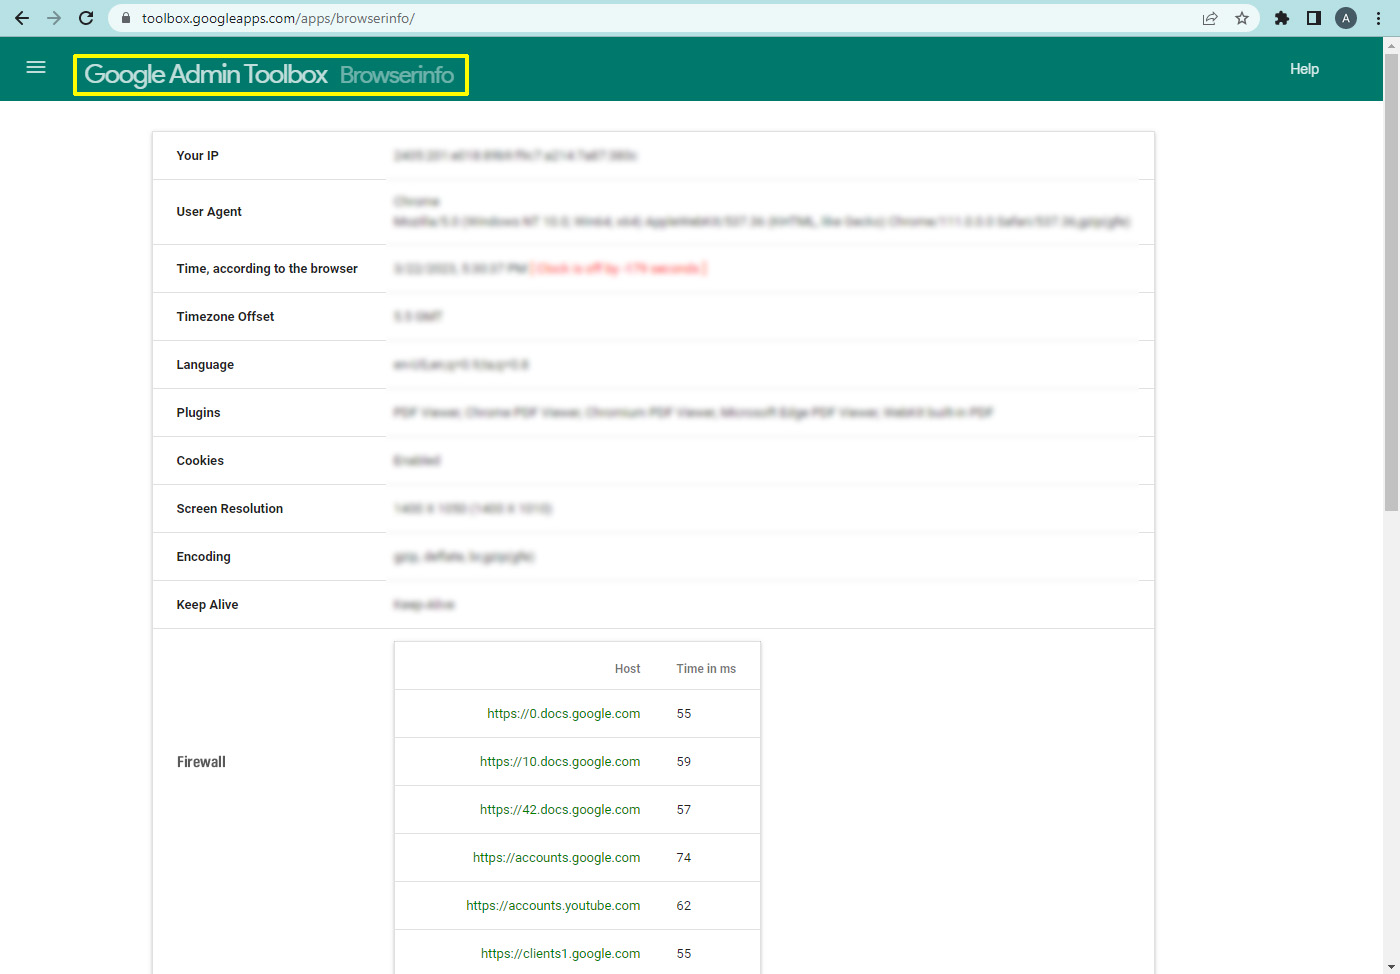
If the user has browser issues you can use Browserinfo and Useragent to troubleshoot issues. Browserinfo is a browser-based debugging tool used to capture client-side information. The browser info contains details like Your IP address, User-agent name, Time according to the browser, Time zone offset, Language, Plugins, Cookies, Screen resolution, Encoding, Keep-alive, and Firewall details.
Use Browserinfo when you have connectivity issues. The uses of Browserinfo tools include the following.
- Collect important browser parameters
- Detect installed plug-ins
- Check connectivity
- Calculating HTTP latency to Google services
- Detecting whether a firewall rule has impaired connectivity
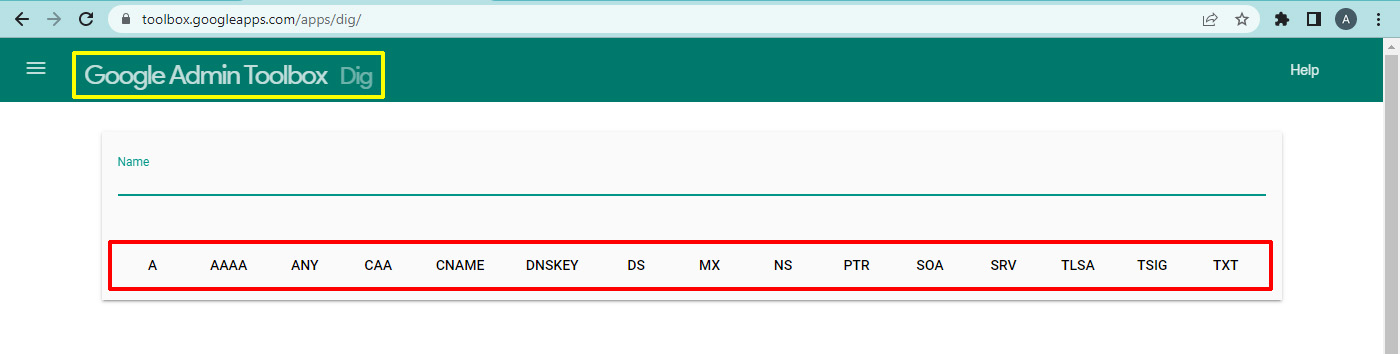
DNS Verification
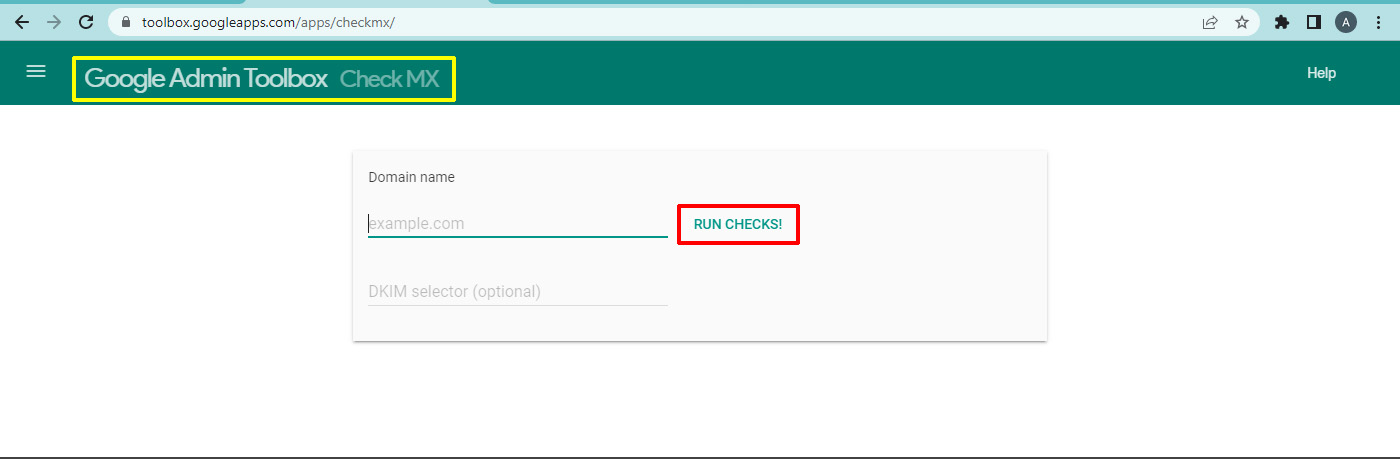
The DNS verification is made by checking the MX DNS records. Checker MX is used to find the common misconfiguration in your MX DNS records. Checker MX is also used to establish the current status of your domain. Check MX and do checks like general DNS sanity checks, workspace-related issues, and other issues.
General DNS sanity checks
- How many NS servers are there?
- Are Ns servers are reachable?
- Do they know about each other?
- Are NS servers synchronized?
Google Workspace-related issues
- Do MX records for the domain match the recommended set setup are there any misconfigurations?
- Are there servers that aren’t part of a normal configuration?
Other checks
- Do the mail exchangers correctly correspond to the A records?
- Are there CNAME records for the bare domain?
- Do the DNS responses match the standard UDP responses?
- After completing the checks user will get the flags if the mail flow is
- Working smoothly – It shows a green flag.
- Working but indicating issues that need to be addressed – It shows a Yellow flag.
- Experiencing an outage. – It shows a red flag.
Encoding and Decoding
Using the encoding and decoding you can debug web-related issues with a set of encoding and decoding functions.
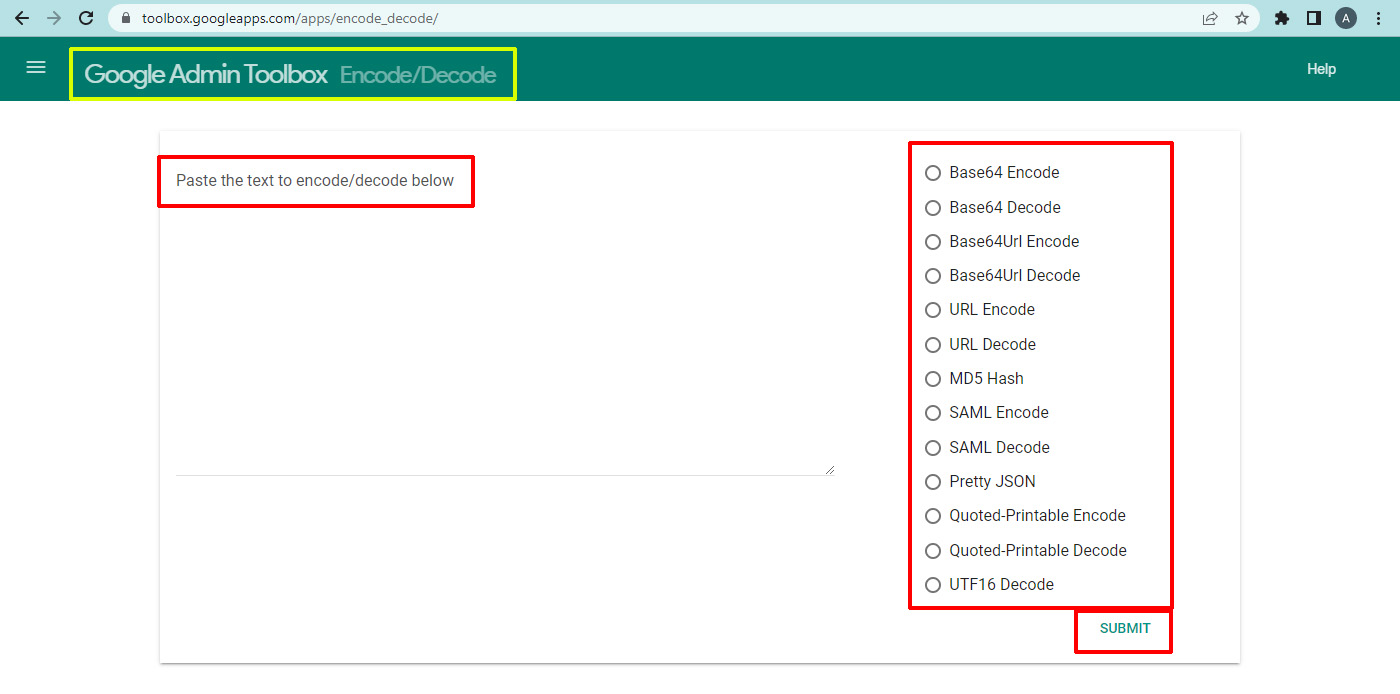
The encoding and decoding functions include the following.
- Base64 encode
- Base64 decode
- Base64Url encode
- URL encode
- URL decode
- MD5 Hash
- SAML encode
- SAML decode
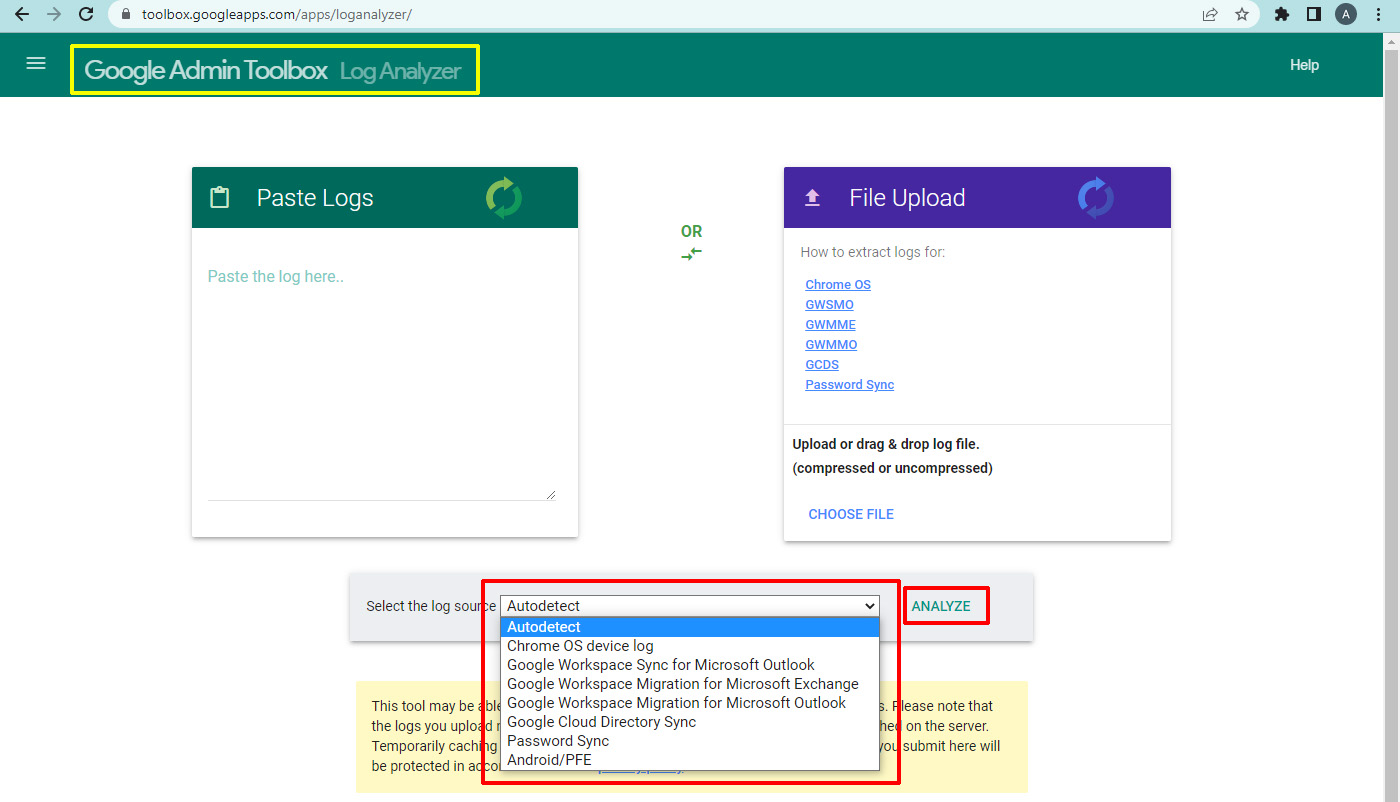
Log Analyzer
A log analyzer helps to explain errors and warnings in log files. The log files are generated by some Google tools and products. Paste or upload the log file and select the log source. After the log analysis, the analyzer detects an issue it will highlights the problem, and explains. Many of the issues are identified within a few minutes of submission. Select the log source and analyze.
Logs can be extracted from
- Chrome OS
- GWSMO
- GWMME
- GWMMO
- GCDS
- Password Sync
Analyze HAR Files
HAR analyzer analyses the HAR Files. How to get a HAR capture. HAR (HTTP Archive) is a file format used by several HTTP session tools to export the captured data. The format is a JSON object with a particular set of fields. Note that not all the fields in the HAR format are mandatory, and in many cases, some information won’t be saved to the file. Get a capture of an HTTP session in browsers, like Google Chrome, Microsoft Edge, and Mozilla Firefox.
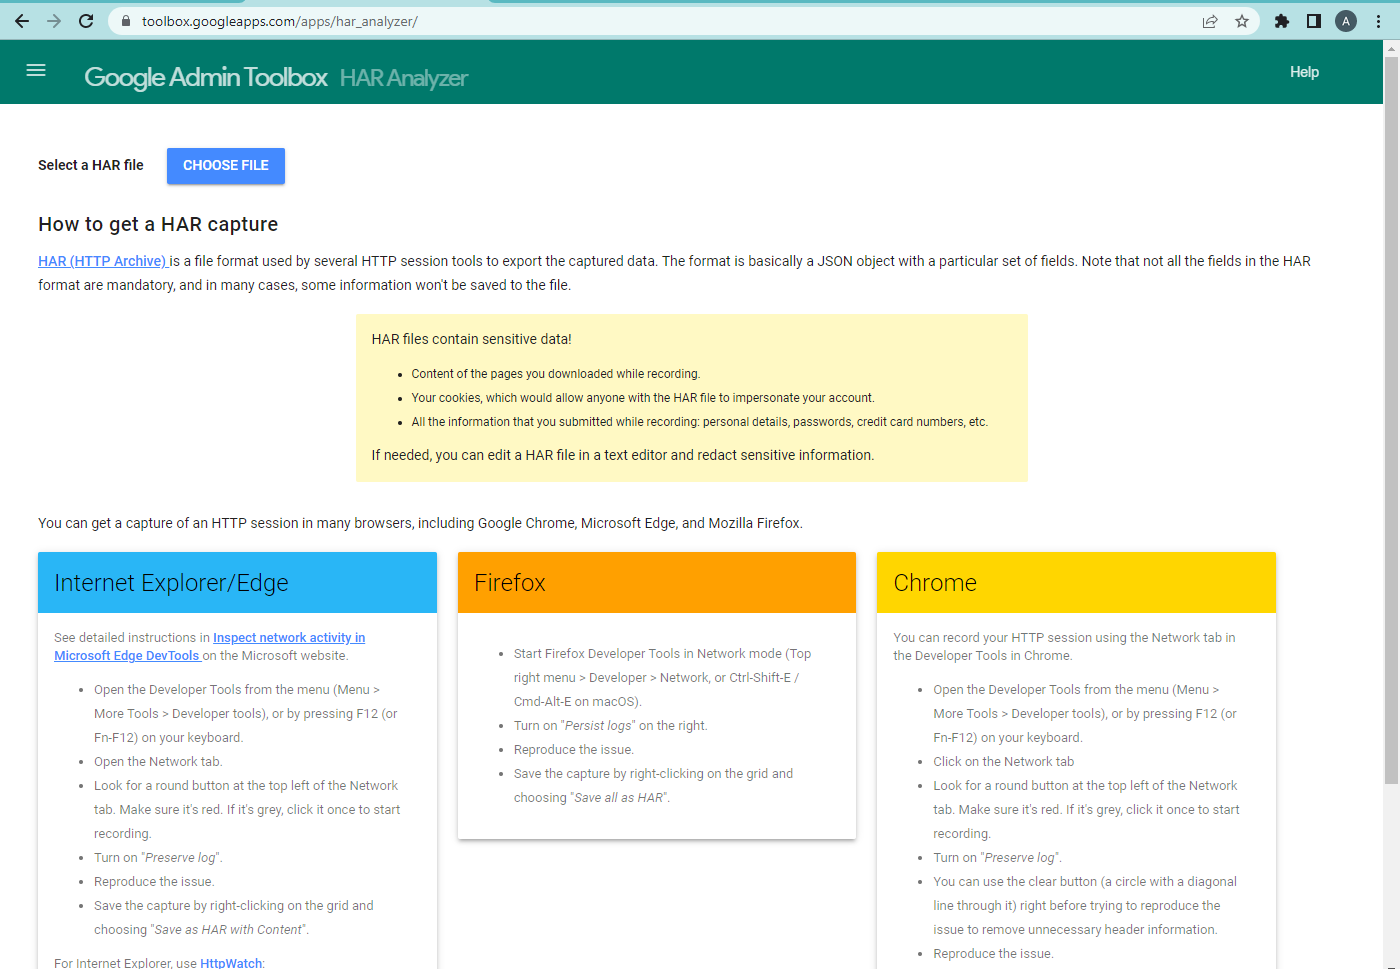
For Chrome
- Open the Developer Tools from the menu (Menu > More Tools > Developer tools), or by pressing F12 (or Fn-F12) on your keyboard.
- Click on the Network tab
- Look for a red round button.
- If the button is grey, click it once to start recording.
- Turn on the “Preserve log”.
- Use the clear button before trying to reproduce the issue to remove unnecessary header information.
- Reproduce the issue.
- Save the capture by right-clicking on the grid and choosing “Save as HAR with Content”.

Investigate mail issues
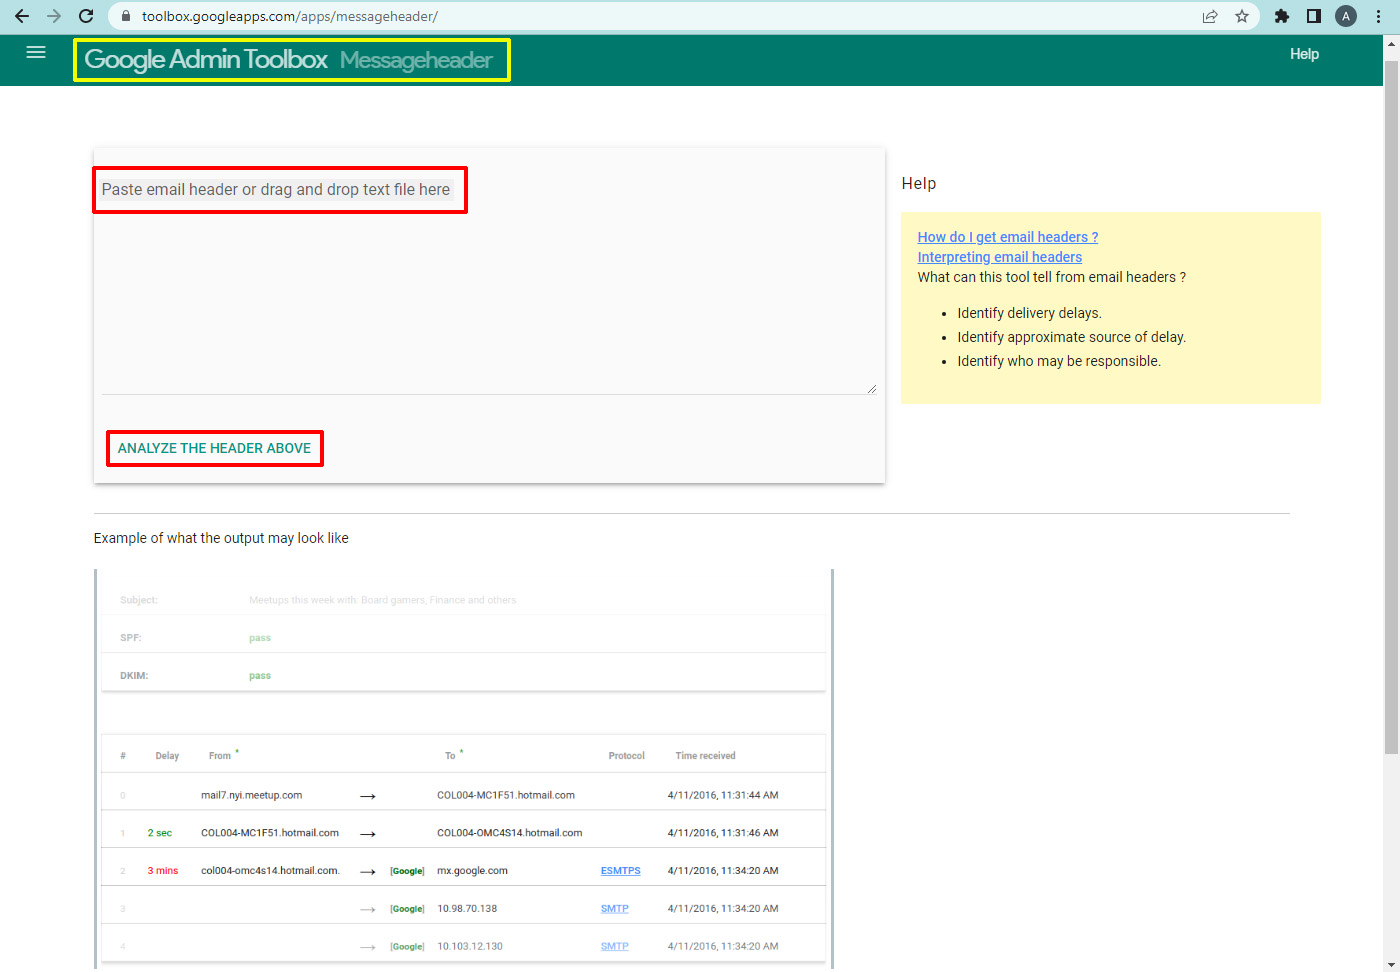
Message header analyzes the SMTP message headers, which helps identify the root cause of delivery delays in emails. You can detect misconfigured servers and mail-routing problems by using a message header. The Message header tool analyzes the mail header and it says about the following.
- Identify delivery delays.
- Find the approximate source of delay.
- Identify who may be responsible.
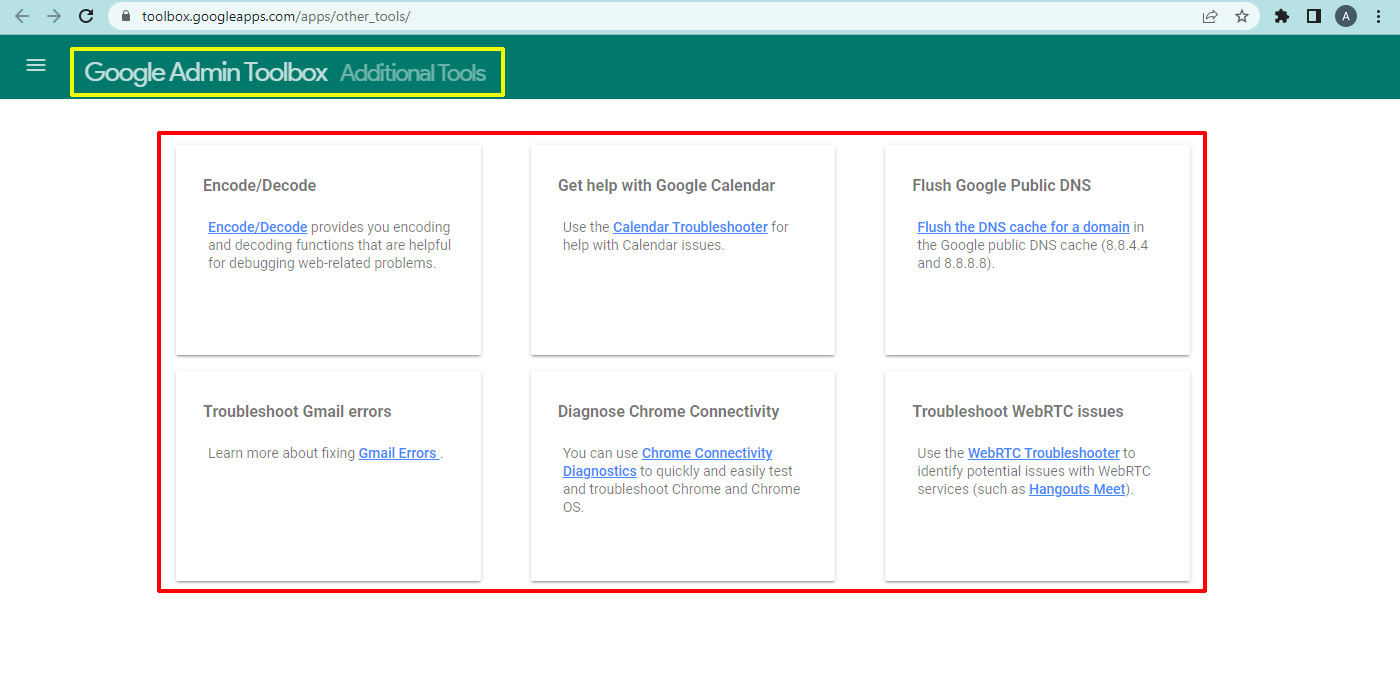
Additional Tools
The additional tools present in the Google admin toolbox are
- Calendar Troubleshooter
- Google Public DNS Cache
- Gmail errors
- Chrome connectivity diagnostics
- WebRTC Troubleshooter
Our Services
Navohosting is one of the Google Workspace resellers. We offer the workspace suite for the users.
- Google workspace
- Web hosting
- Web design
Google Workspace data migration from file shares
Steps to Enable Google Workspace 2-Step Verification
To learn more about Google Workspace check here. Contact us for more details about our services.
